Reports - Summary columns, formula columns, place holder columns
Summary columns are used to perform aggregate functions like sum( ), max( ), min ( ), count ( ) etc;
Lets us understand with an example
I want to create a report which display Empno, Ename and Sal of the employees working in deptno =10
I also want to display total sal.
Empno Ename Sal
7782 CLARK 2450
7839 KING 5000
7934 MILLER 1300
----------
8750
------------
To get the value 8750, we need to use Summary column.
Lets us develop the report using wizard
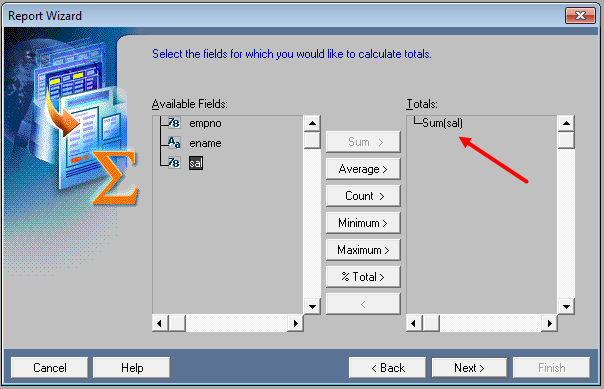
Open report builder tool Use the report wizard OkNext Create both Web and Paper layout Next Tabular SQL Query select empno, ename, sal from emp where deptno =10; Connect � provide connection details Next Move all the fields from Available Fields to Displayed Fields Next Select sal from available Fields , click on sum
Next Next Predefined template select Green Next Finish
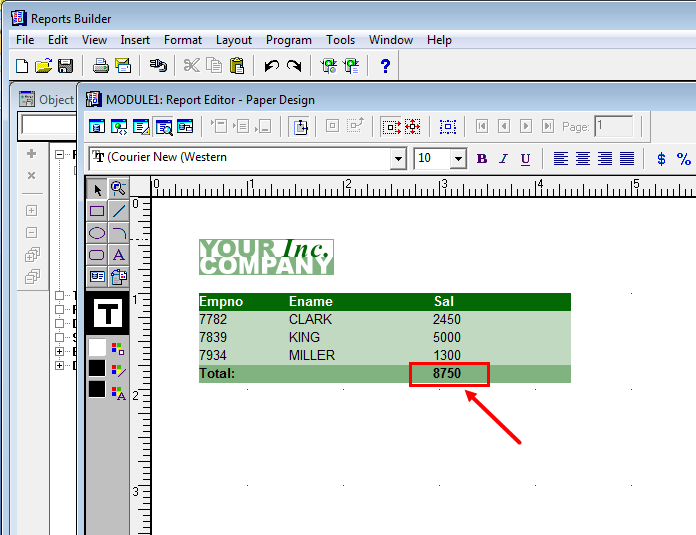
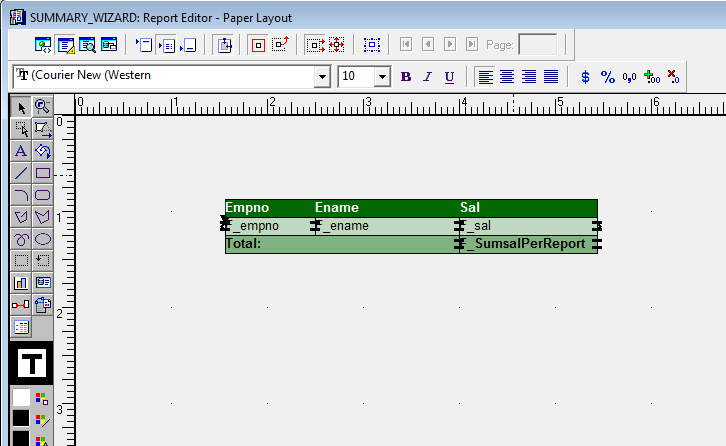
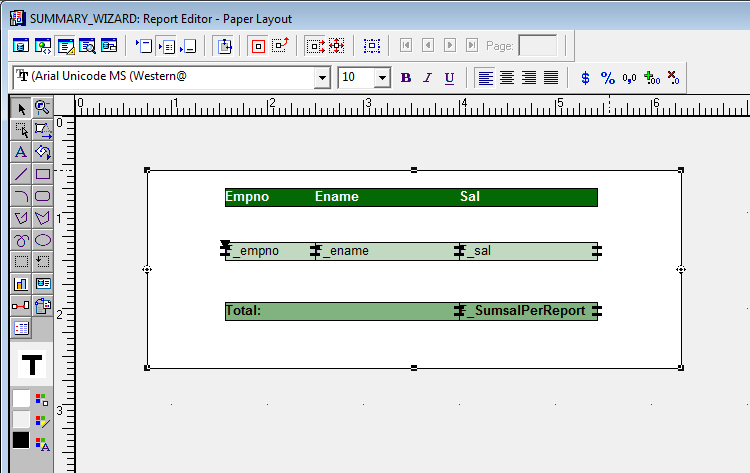
You will get the following output
The value 8750, is the result of the summary column.
Lets us save the report.
File Save as File Name: SUMMARY_WIZARD
Save as Type: Report Binary ( *.rdf )
Lets us look more in detail , about the summary column.
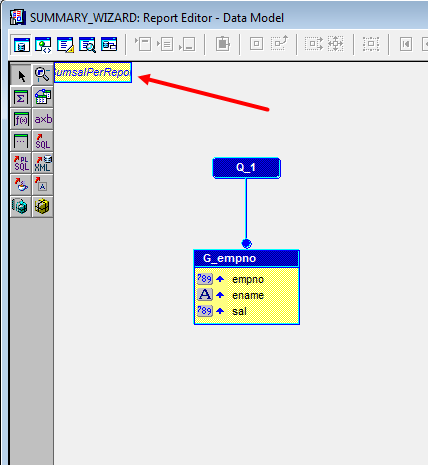
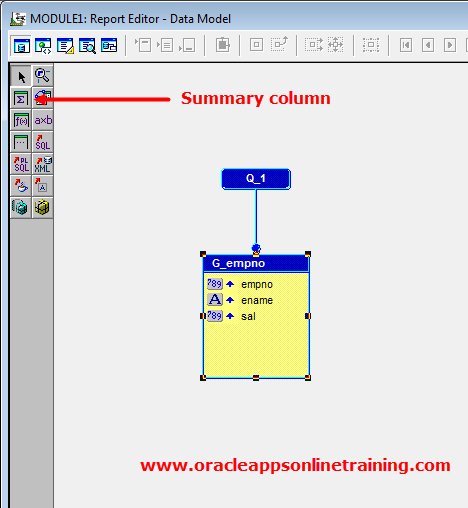
Open the Data Model of the report.
In the Data Model, Summary Column is created by the wizard.
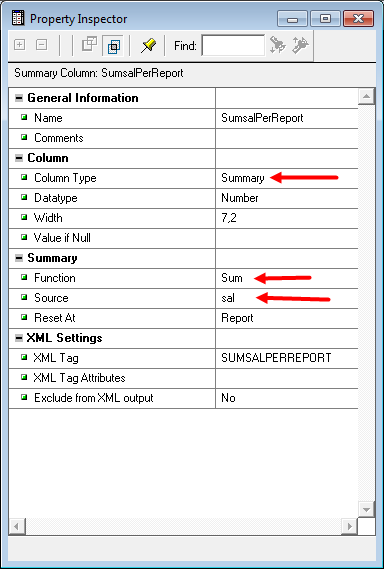
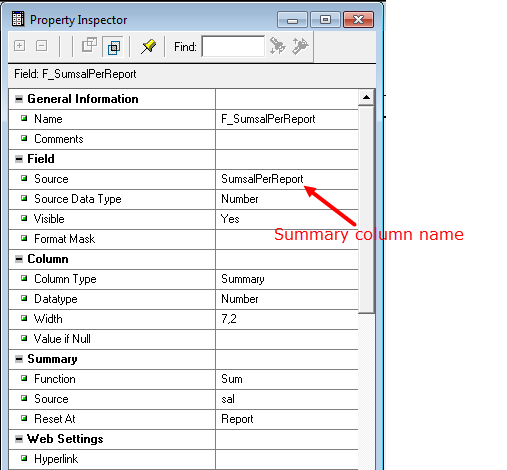
Double click on the Summary Column, you will get the following information
Name - SumsalPerReport
Column Type - Summary -- ( Indicates that it is a Summary Column )
Function - Sum
Source - sal
The above information helps us to understand that it is calculating function sum ( ) on column sal.
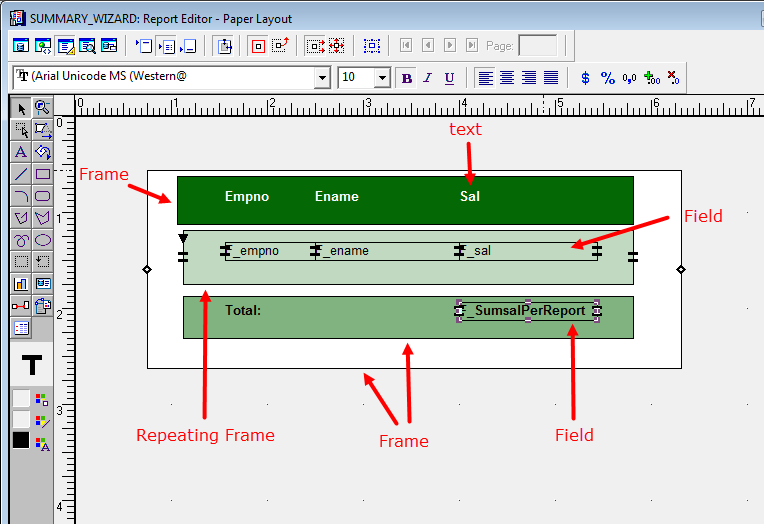
Now, Lets understand the layout of the report.
Select Paper Layout
Select all frames by using Ctrl+A, and move the frames to center.
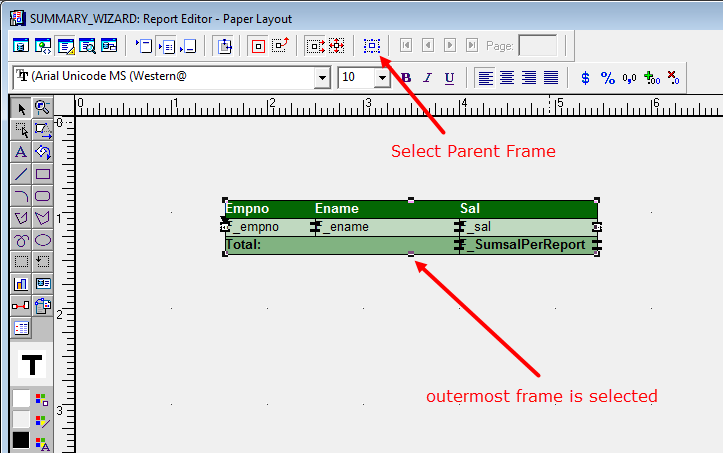
Select outermost parent frame, by using select parent frame icon
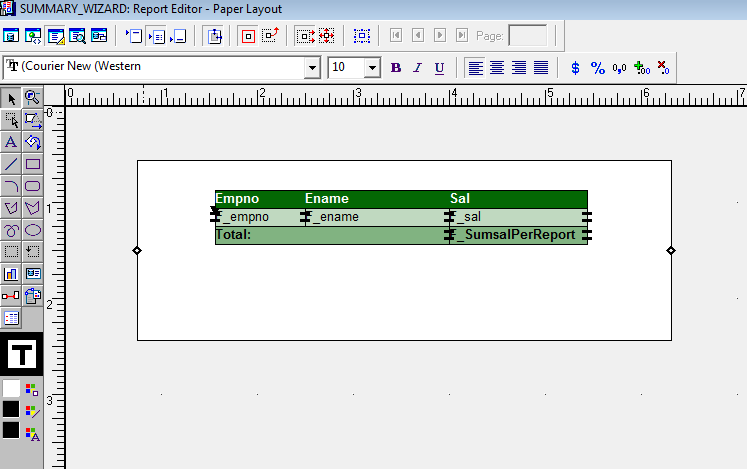
Drag the four corners and make the frame bigger.
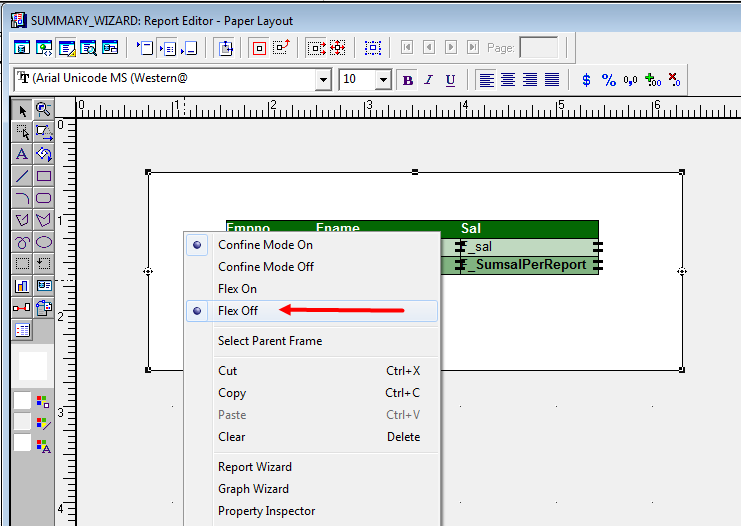
Right click on in the frame , and make the flex to off.
For better understanding of the layout, give spacing between the frames.
Let us extend all the frames, for better understanding of the layout.
Observe the source for the field F_SumsalPerReport, it is SumsalPerReport ( Summary Column Name )
As we have now analyzed the Data Model and layout Model of the report, We will try to develop the same report manually in the next example.
Developing the above report manually
Open Report Builder Build a new report manually Ok
You will be directed to Data Model of the report.
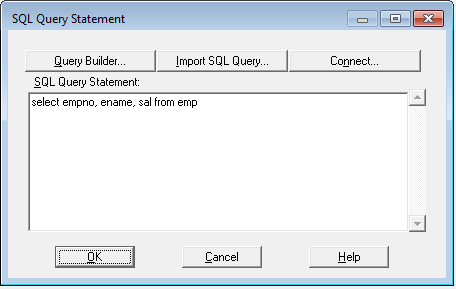
Click on SQL and click on Work Area. We get SQL Query Statement window.
Provide the following query
select empno, ename, sal from emp where deptno =10; OK
Provide the connection Details, User Name , password and the Database OK
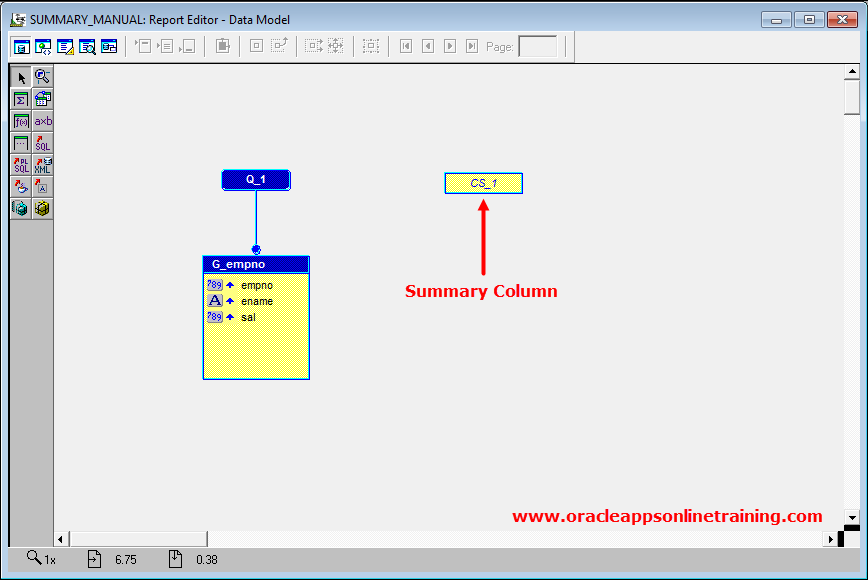
This is how the Data Model looks like.
Click on summary column and click on work area.
A Summary Column is created.
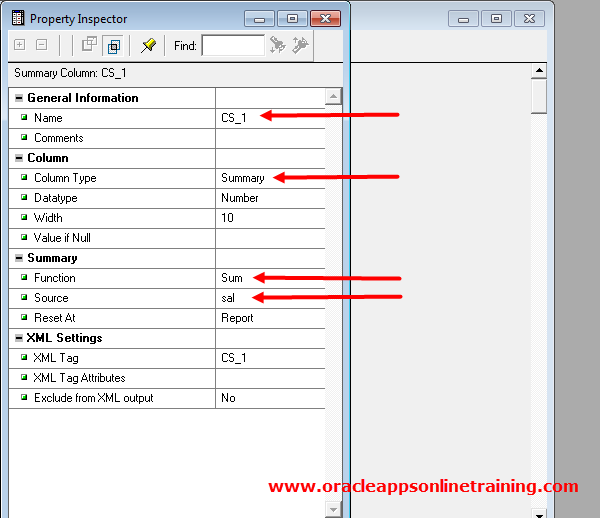
Observe, the name of the Summary column is CS_1
Double click on CS_1, property Inspector window is opened.
In property inspector, Column Type is Summary.
It means that it is a Summary Column.
Function - Sum ( As we need to calculate total )
Change the source to sal, as we want calculate total of sal.
We are done with Data Model. Close the Data Model.
We need to design the report in layout model.
In Object Navigator Double click on Paper Layout
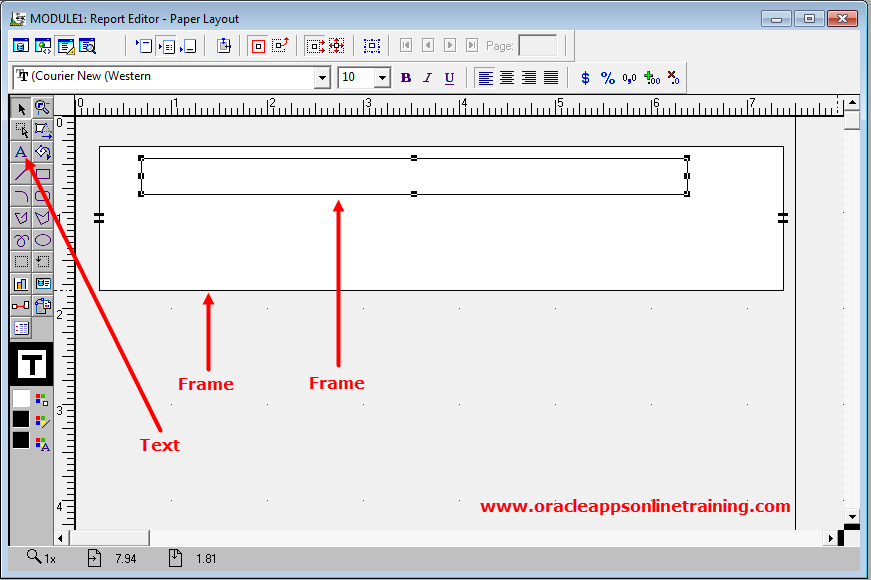
Click on Frame Draw the frame in the work area.
Right Click on the frame Property Inspector Provide the following property General Layout
Vertical Elasticity -- Expand
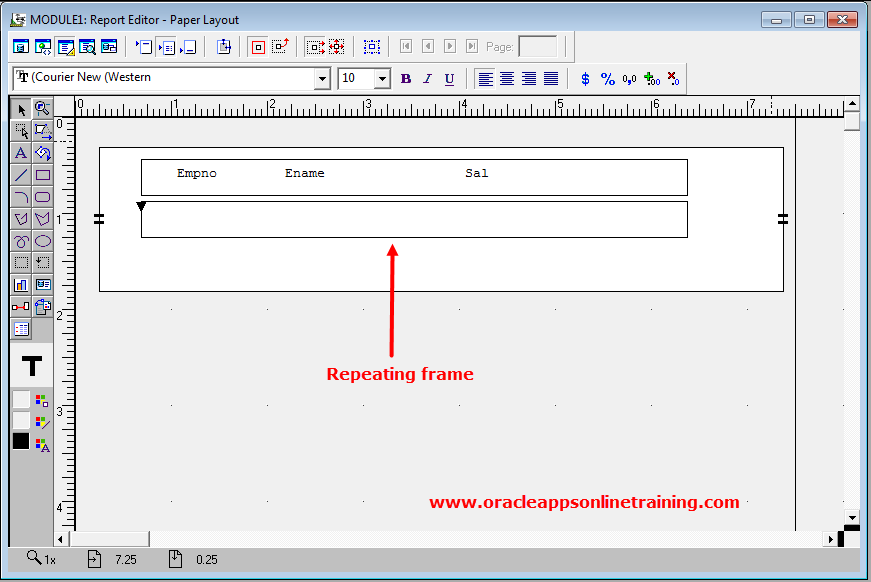
Place a frame inside the frame.
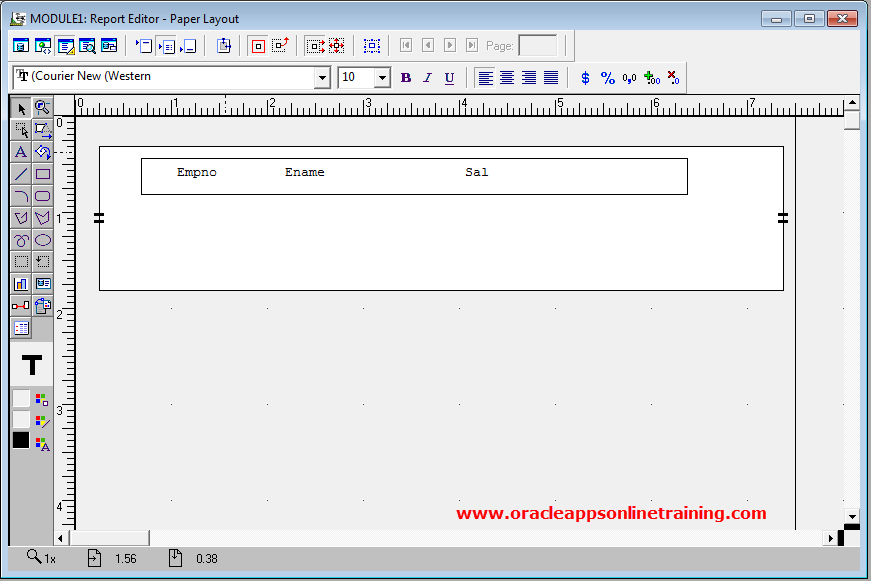
Click on text, place three text items ( Empno, Ename, sal ) in the inner frame.
Place a repeating frame below the header frame.
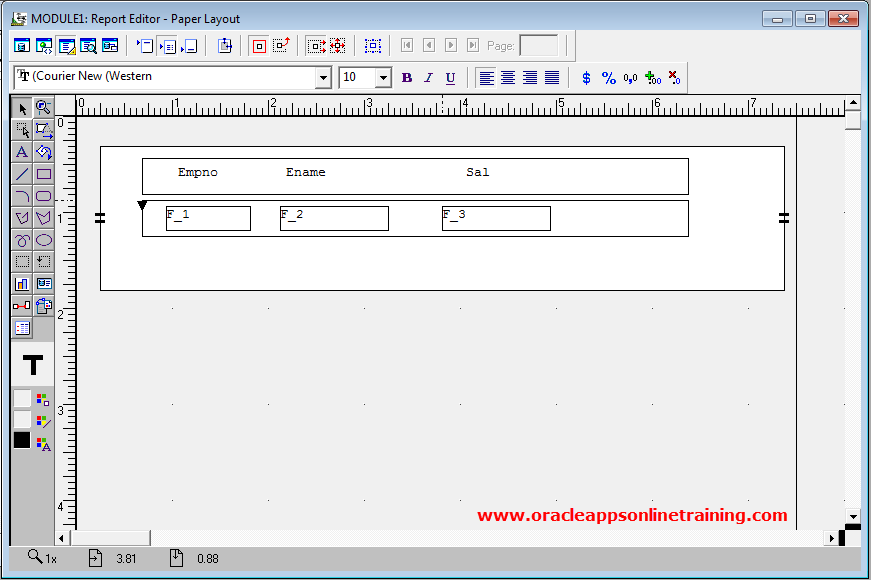
Place three fields inside the repeating frame.
Provide the source for the repeating frame.
Right click on the Repeating Frame Property Inspector Repeating Frame
Source -- G_Empno ( It is the name of the group in data model ).
Similarly, provide the source for the fields.
Right click on the Field ( F_1) Property Inspector Field
Source -- Empno ( It is the column name ).
Right click on the Field ( F_2) Property Inspector Field
Source -- Ename ( It is the column name ).
Right click on the Field ( F_3) Property Inspector Field
Source -- Sal ( It is the column name ).
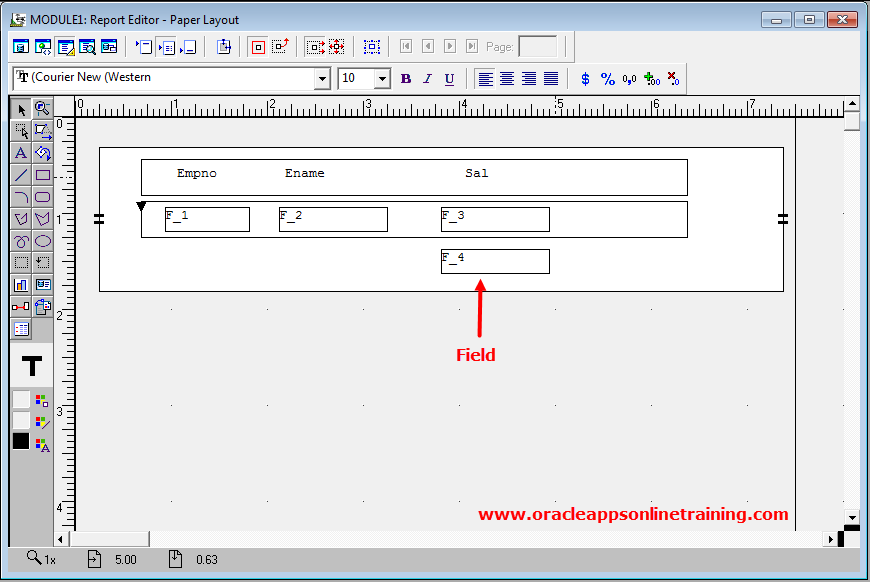
Place another field below F_3
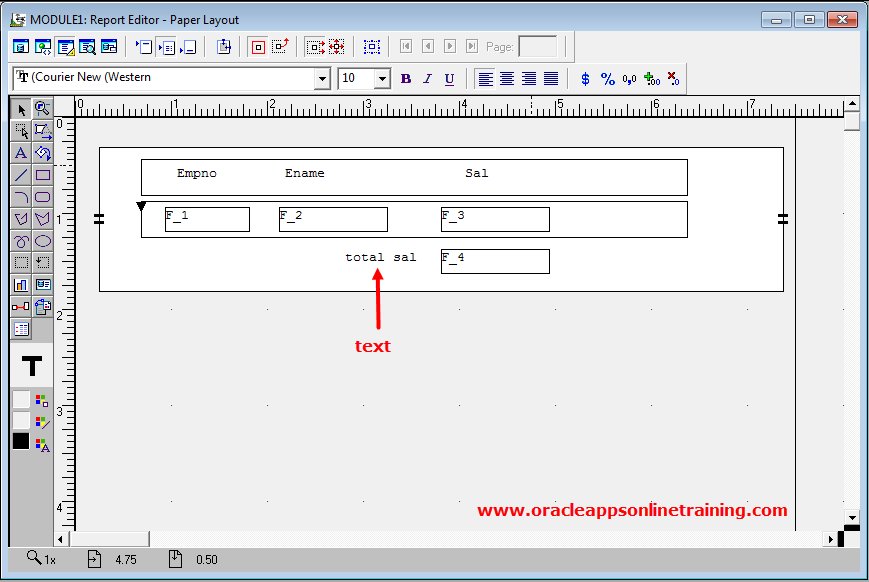
Place a text before the field as total sal.
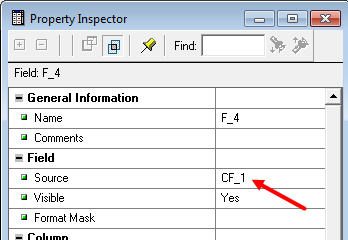
We want the field F_4 to display total Sal.
We need to provide the source to the field F_4
Right click on the field F_4 property inspector
Source -- CS_1 ( It the name of the Summary Column )
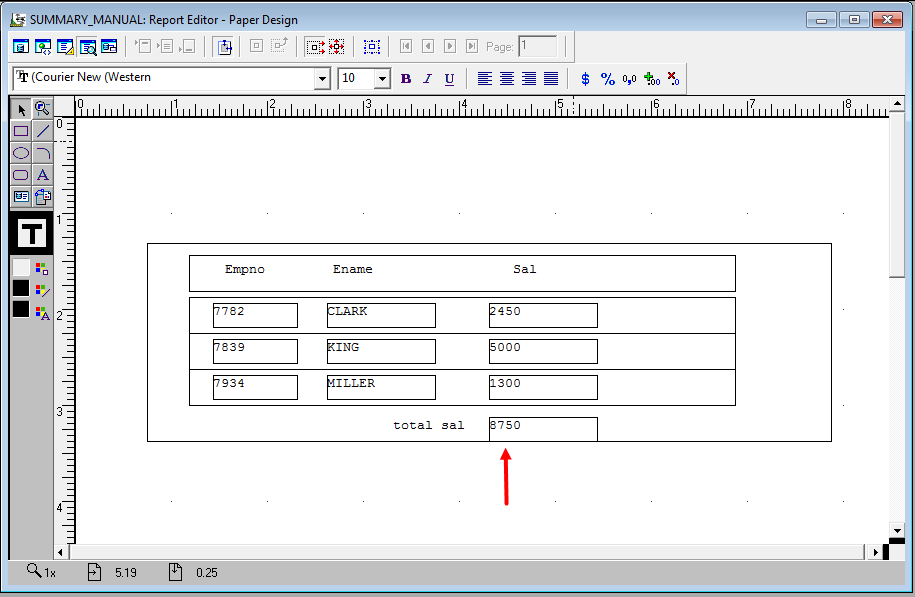
File � Save as SUMMARY_MANUAL.rdf
In the Object Navigator, Program Compile All
Program Run Paper Layout
We are now able to get sum of sal.
So, Summary column is used to calculate aggregate functions.
Formula Column
Formula column is used to perform calculations.
Let us understand it with an example
I want to create a report which will display the following columns
Empo Ename Sal Annual_sal
7369 SMITH 800 9600
7499 ALLEN 1600 19200
7521 WARD 1250 15000
As we know that Empno, Ename and Sal are available from the EMP table.
For the 4th column ie Annual_sal, we need to perform calculation.
For Annual_sal, we use Formula column
Open report builder tool Build a new report manually OK
You will be directed to data model of the report.
Click on SQL click on work area We get SQL Query statement window
Provide the query select empno, ename, sal from emp OK
Provide connection details, User Name, Password and Database Connect
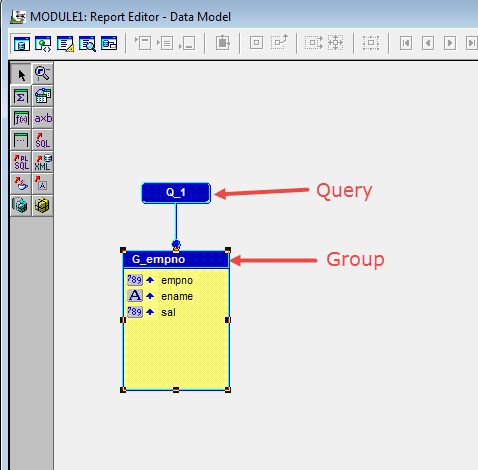
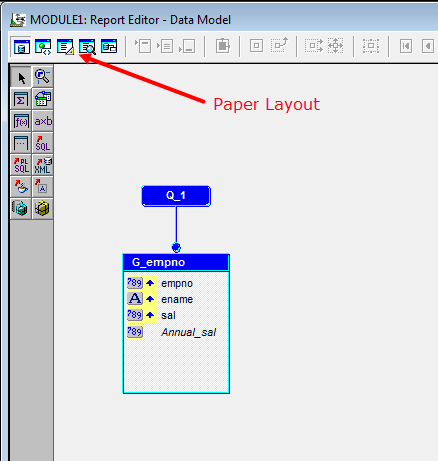
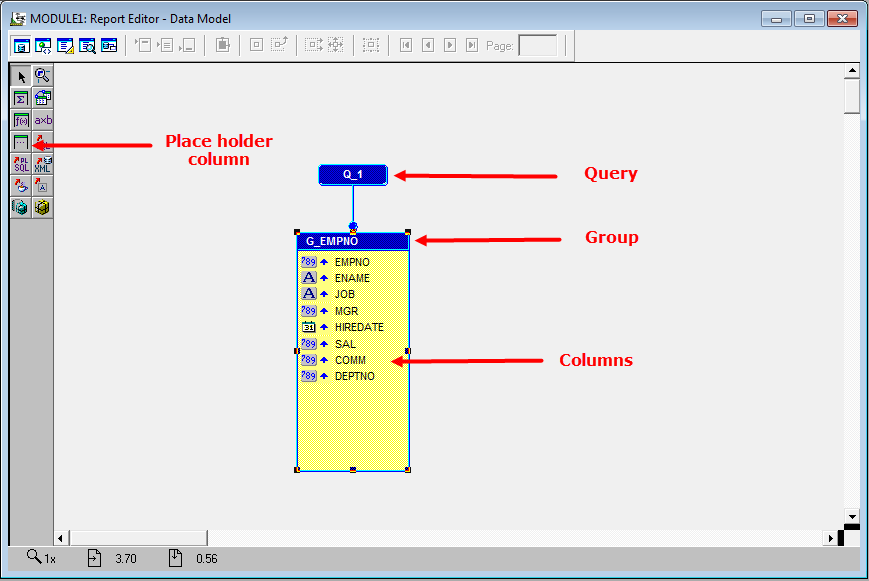
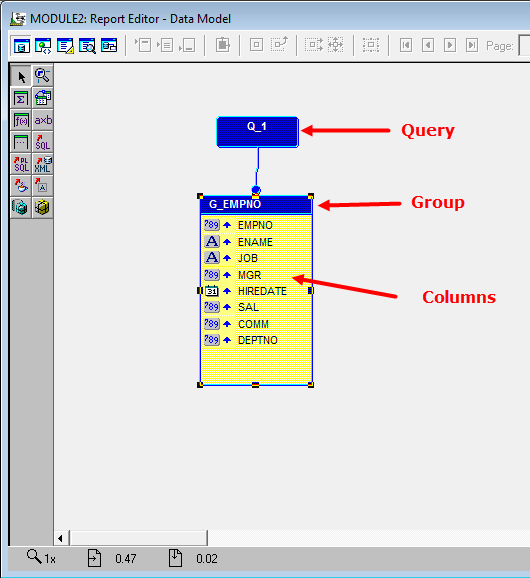
Now, our Data Model contains Query ( Q_1 )
Query will result in Group ( G_empno ) and Group is collection of columns.
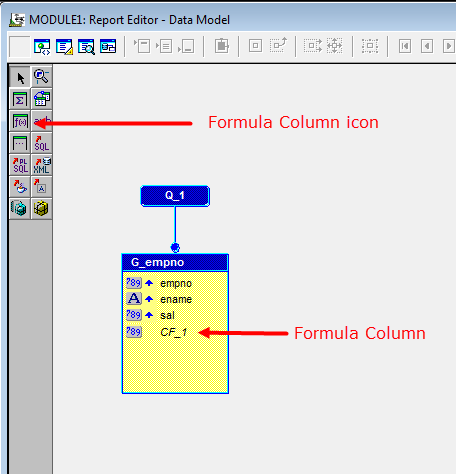
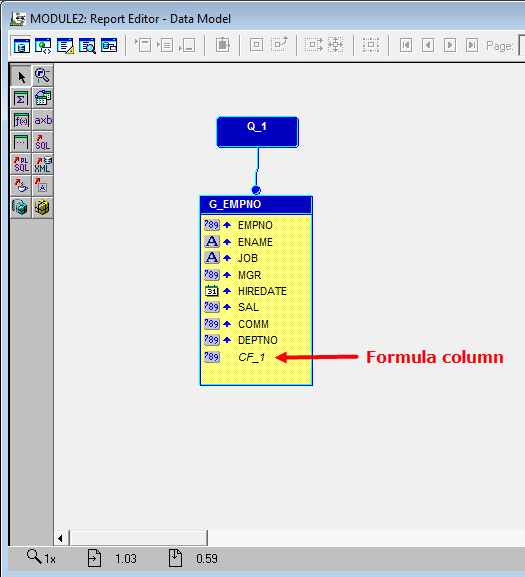
Click on Formula Column icon and click inside the group.
Observe Formula Column (CF_1) is create in the group.
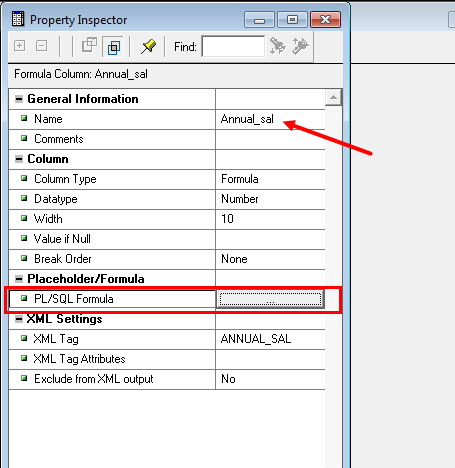
Right click on the formula column Property Inspector
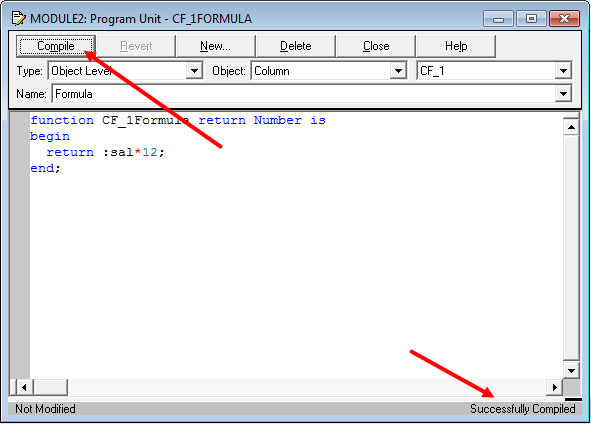
Double click on PL/SQL Formula column, provide the following code
function CF_1Formula return Number is
begin
return :sal*12;
end;
Click on compile. We get message Successfully Compiled.
In the above code :sal refers to the column in the data model. We need to prefix with : ( colon )
Close MODULE1: Program Unit - CF_1FORMULA window.
Close property inspector.
We are done with Data Model.
Now, lets us design the layout of the report.
Click on Paper Layout symbol
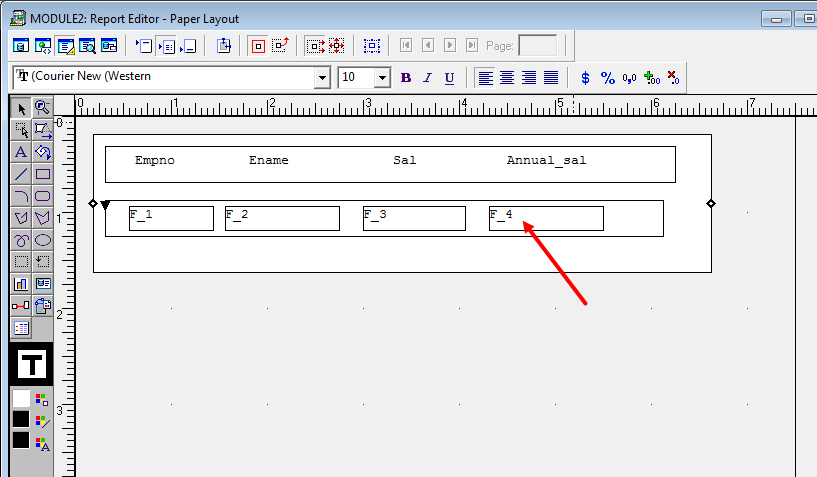
We will be directed to the paper layout, design the report using Frame, Repeating Frames, Text and Fields ( similar to the example of develop the reports manually ).
As we know, we need to provide the source for the repeating frame and the fields.
For the repeating frame, we need to provide source as group ( G_empno ).
For the fields, we need to provide the source as column name.
For the last field ( F_4 ), provide the source as CF_1, as it needs to get the data from the formula column.
Lets save the report.
File Save as File Name: Formula Save as type: Report Binary (*.rdf )
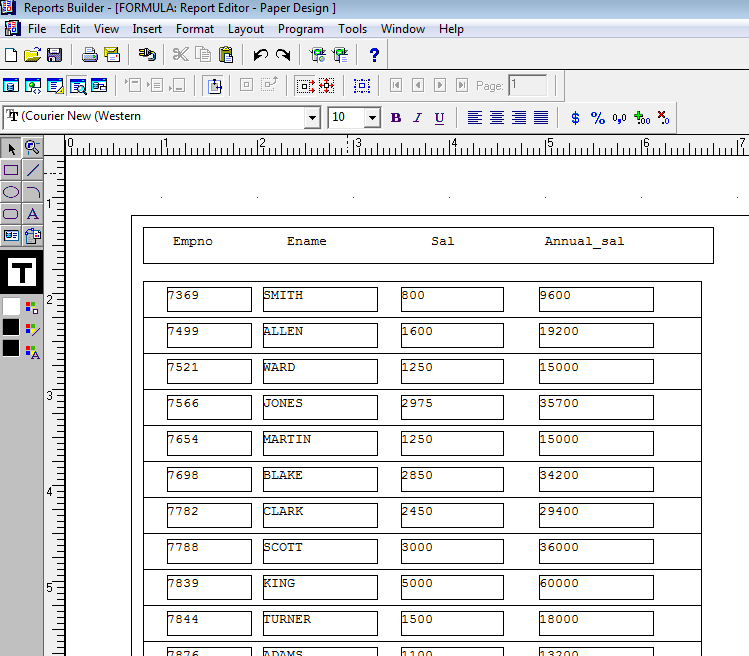
Run the report.
We get empno, ename , sal and Annual_sal of the employees.
The values of the Annual_sal are the result of the Formula Column.
So, use Formula Column, when you need to perform calculations.
Place holder Column
Place Holder column is a variable.
So, we can store value in Place Holder column.
Code for assigning value to the place holder column, has to be provided in formula column.
Place holder column can be placed in report layout.
To understand place holder column, practice all the three examples.
Ex1:
Create a report manually based on the following query
select * from emp;
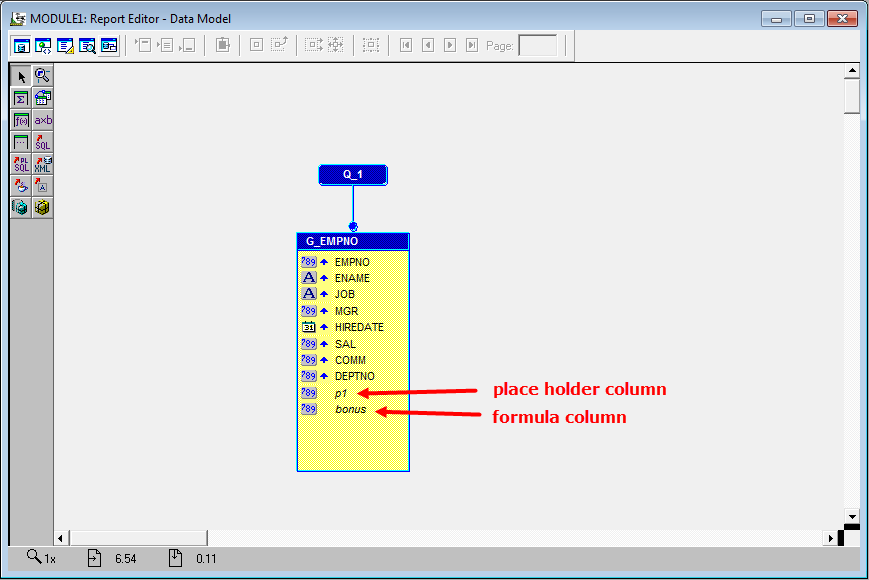
This is how the Data Model looks like
We have query ( Q_1 ).
Query results in a group G_EMPNO
Group is collection of columns.
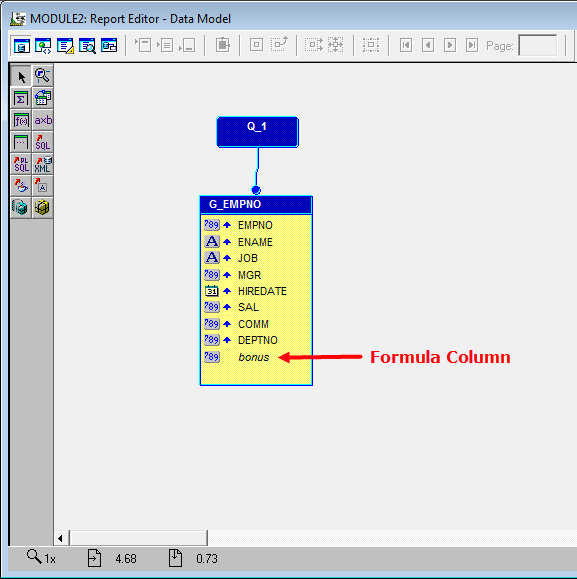
Place a place holder column and formula column in the group.
Rename the place holder column to p1 ( By using property inspector )
Rename the formula column to bonus ( By using property inspector )
Right click on the formula column PL/SQL Editor
Provide the following code
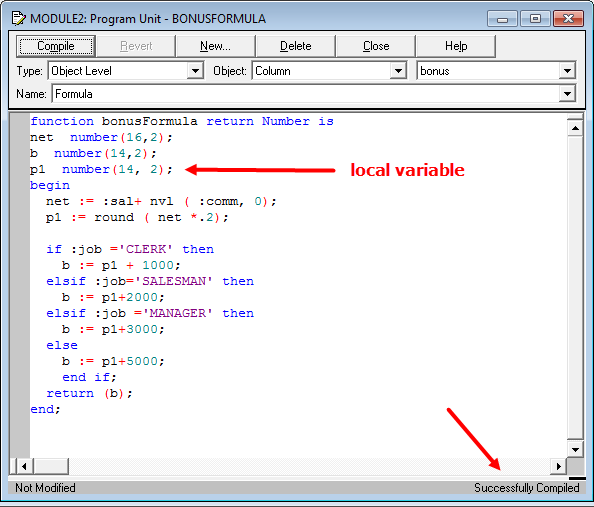
function bonusFormula return Number is
net number(16,2);
b number(14,2);
begin
net := :sal+ nvl ( :comm, 0);
:p1 := round ( net *.2);
if :job ='CLERK' then
b := :p1 + 1000;
elsif :job='SALESMAN' then
b := :p1+2000;
elsif :job ='MANAGER' then
b := :p1+3000;
else
b := :p1+5000;
end if;
return (b);
end;
click on compile.
You should get a message "Successfully compiled"
Click on close.
In the above code, we are using place holder column ( p1 )
We are initializing place holder column by using a formula column.
Analyze the above logic.
Formula column bonus, is calculation bonus of the employees.
net and b are local variables.
20% of net salary, is stored in p1 ( p1 is a place holder column )
When initializing place holder column, we need to prefix with : ( colon )
If the employee is CLERK,
bonus is 20% of net salary + 1000
If the employee is SALESMAN,
bonus is 20% of net salary + 2000
If the employee is MANAGER,
bonus is 20% of net salary + 3000
for other jobs,
bonus is 20% of net salary + 5000
In the Data Model, total no of column in the group G_EMPNO is ten.
Eight columns are returned by the query.
One column is a place holder column.
One column is a formula column.
Invoke the report wizard by click on Tools Report Wizard Create both Web and Paper Layout Select Tabular SQL Query Data source definition : select * from emp ( Query is present ) Move all the fields from Available Fields to Displayed Fields ( Observer we have 10 fields ) Next Next Select No template Finish
In the output, we have total ten fields.
The last two fields are p1 and bonus.
P1 , is a place holder column.
Bonus, is a formula column.
So, we can have the place holder column in the output.
Save the report PLACE_HOLDER_ONE.rdf
Lets us try the 2nd example
Ex 2:
Create a report manually based on the following query
select * from emp;
This is how the Data Model looks like
We have query ( Q_1 ).
Query results in a group G_EMPNO
Group is collection of columns.
Place a formula column inside the group.
Rename the formula column to bonus ( By using property inspector )
Right click on the formula column PL/SQL Editor
Provide the following code
function bonusFormula return Number is
net number(16,2);
b number(14,2);
p1 number(14, 2);
begin
net := :sal+ nvl ( :comm, 0);
p1 := round ( net *.2);
if :job ='CLERK' then
b := p1 + 1000;
elsif :job='SALESMAN' then
b := p1+2000;
elsif :job ='MANAGER' then
b := p1+3000;
else
b := p1+5000;
end if;
return (b);
end;
click on compile.
You should get a message "Successfully compiled"
Click on close.
In this example, we have three local variables
net, b and p1
Where as in the Ex 1, p1 is a place holder column.
Invoke the report wizard by click on Tools Report Wizard Create both Web and Paper Layout Select Tabular SQL Query Data source definition : select * from emp ( Query is present ) Move all the fields from Available Fields to Displayed Fields ( Observer we have 9 fields ) Next Next Select No template Finish
In the output, we have total nine fields.
The last field is bonus.
We are unable to display p1, in the report output. Because p1 is a local variable.
So, we cannot have local variables in the output. But, can have the place holder column in the output.
Save the report PLACE_HOLDER_TWO.rdf